 01
Markets 1019 min read
What Is Forex Trading?
An educational explanation of how the foreign exchange market works, how currency pairs are quoted, and how platforms such as Fjord Markets are discussed in trading research.
ReadThese figures are static sample values used for educational illustration only. They are not live market prices and are not investment recommendations.
Reader-funded market literacy · No brokerage, no incentives
Spreads, order routing, margin and drawdown decide more outcomes than any interface does. Fjord Markets Research Desk documents those mechanics in plain English, then turns the same checklist on Fjord Markets — examined here strictly as a study subject, from public material only.
Nothing to sign up for · Nothing to deposit · No orders executed · Unaffiliated with Fjord Markets
9
Guides published
6
Review checkpoints
0
Paid placements
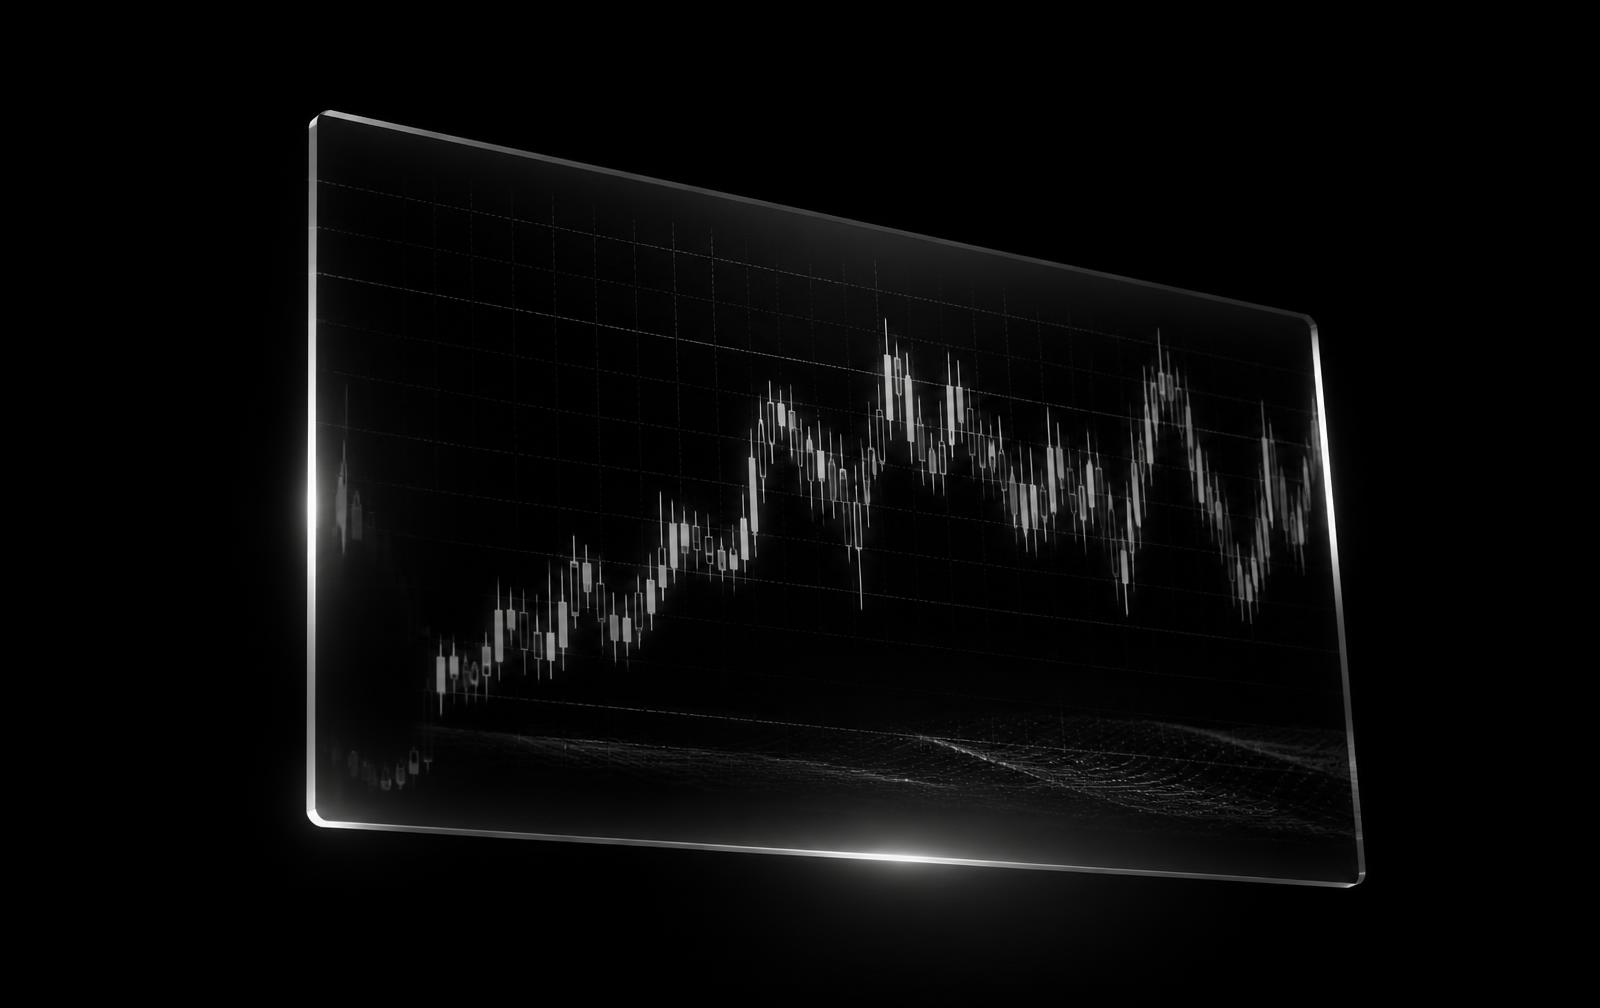
Spread structure
Documented
Risk controls
Reviewed
Order types
Compared
01 / Orientation
Everything here is written to be read before a platform is opened, not after.
Most traders meet a platform before they meet the market. They see an interface, a chart and an order ticket, and they start pressing buttons. This site inverts that order. We publish structured trading education — currency markets, digital assets, charting, position sizing, behaviour — and only then discuss how a specific trading environment such as Fjord Markets can be examined against that knowledge.
We are not a broker, an introducing partner or a marketing channel. Nothing on this site can be traded, funded or transacted. Our research about Fjord Markets is compiled from publicly available material and general platform-evaluation principles, and it is clearly separated from anything the platform itself publishes.
Main research file
Our longest research piece walks through the criteria an independent reader can apply to Fjord Markets — instrument coverage, order handling, cost transparency, risk tooling, onboarding clarity and support structure — alongside the questions that a platform's own materials rarely answer.
03 / Curriculum
Eight structured guides covering the mechanics a trader needs before comparing platforms.
01An educational explanation of how the foreign exchange market works, how currency pairs are quoted, and how platforms such as Fjord Markets are discussed in trading research.
Read 02
How digital-asset markets operate around the clock, what drives their price behaviour, and which structural questions matter when comparing platforms such as Fjord Markets.
Read 03
A structured introduction to beginner trading strategies, from trend following to range trading, and how a written plan is tested before any platform is chosen.
Read 04
Learn how price charts, support and resistance, trend structure and indicators are read, and what charting depth to look for on any trading platform.
Read 05
Position sizing, stop placement, drawdown mathematics and exposure limits — the risk controls that matter more than entries, explained for new traders.
Read 06
Why cognitive bias, loss aversion and impatience derail trading plans, and how process-based routines are used to keep decisions consistent.
Read 07
From order entry to execution and reporting — the technical layers behind a trading platform, and the structural questions to ask about any provider.
Read 08
What volatility measures, why it clusters, how it is quantified with ATR and standard deviation, and what it means for position sizing and platform behaviour.
Read04 / Mechanics
Four layers sit between a click and a filled order. Understanding them changes how any platform is judged.
I
Charting, watchlists, order tickets and account reporting. The part users see, and the part marketing focuses on.
II
Market, limit, stop and conditional orders, plus how partial fills and rejections are surfaced back to the trader.
III
Where quotes come from, how spreads widen in fast markets, and how financing or overnight costs are applied.
IV
Risk limits, margin logic, negative-balance handling, statements and the audit trail behind every position.
05 / Tool
Model both directions of a move. Losses are shown with the same prominence as gains, because that is how exposure works.
Educational calculator
Enter a hypothetical starting amount and a percentage move to see how the same move behaves with and against a position. Everything is calculated instantly in your browser and nothing is stored or transmitted.
1× exposure
Favourable scenario
+ 50.00
Balance 1,050.00
Adverse scenario
− 50.00
Balance 950.00
Move that would erase the amount
100.00 %
Against the position, at this multiplier
Risk note
Leverage magnifies losses exactly as it magnifies gains. Trading can result in the loss of the entire amount committed, and in some structures more than that.
This calculator is for educational purposes only. It does not predict real trading outcomes and should not be considered financial advice.

06 / Editorial
Our desk combines market-structure writing, platform documentation review and risk-education work. We publish the criteria we use, we correct errors in public, and we do not accept payment for coverage or positioning. We hold no advisory licence and give no personalised advice.
Public sources
Documentation, industry data, market literature
Fixed criteria
Same framework applied to every platform
No claims
No ratings, awards or performance promises
07 / Latest
Guides are revised as market structure, terminology and platform conventions change.